
eRate2u™

Mobile Apps
Download→Tap & hold empty spot on your home screen→Widgets→Look for eRate2u→Add widget tile to screen→Enter Zip→Let it update
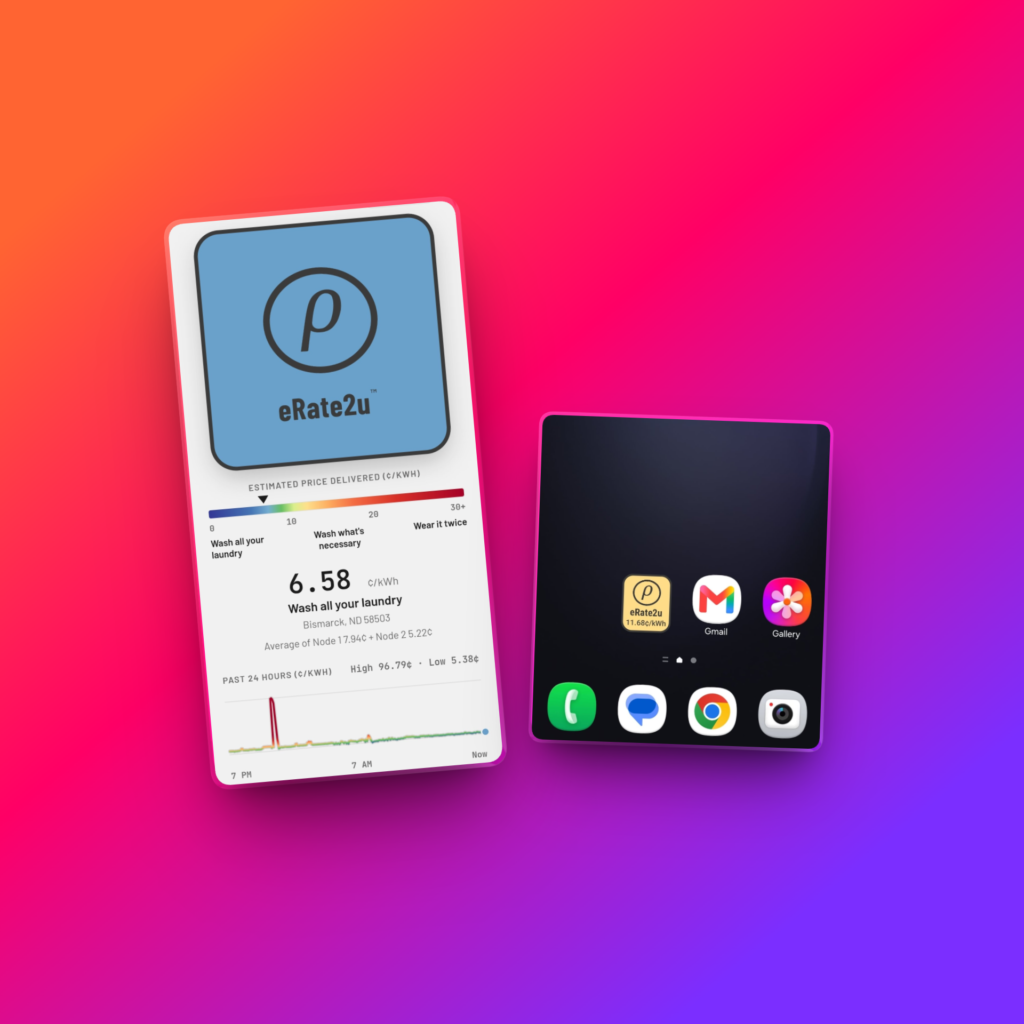
Android
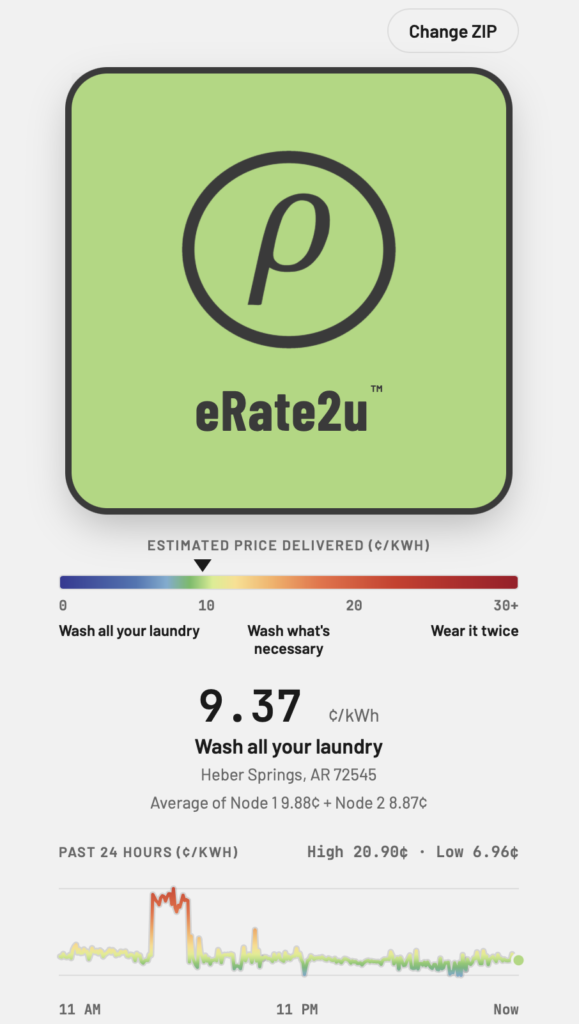
Web App
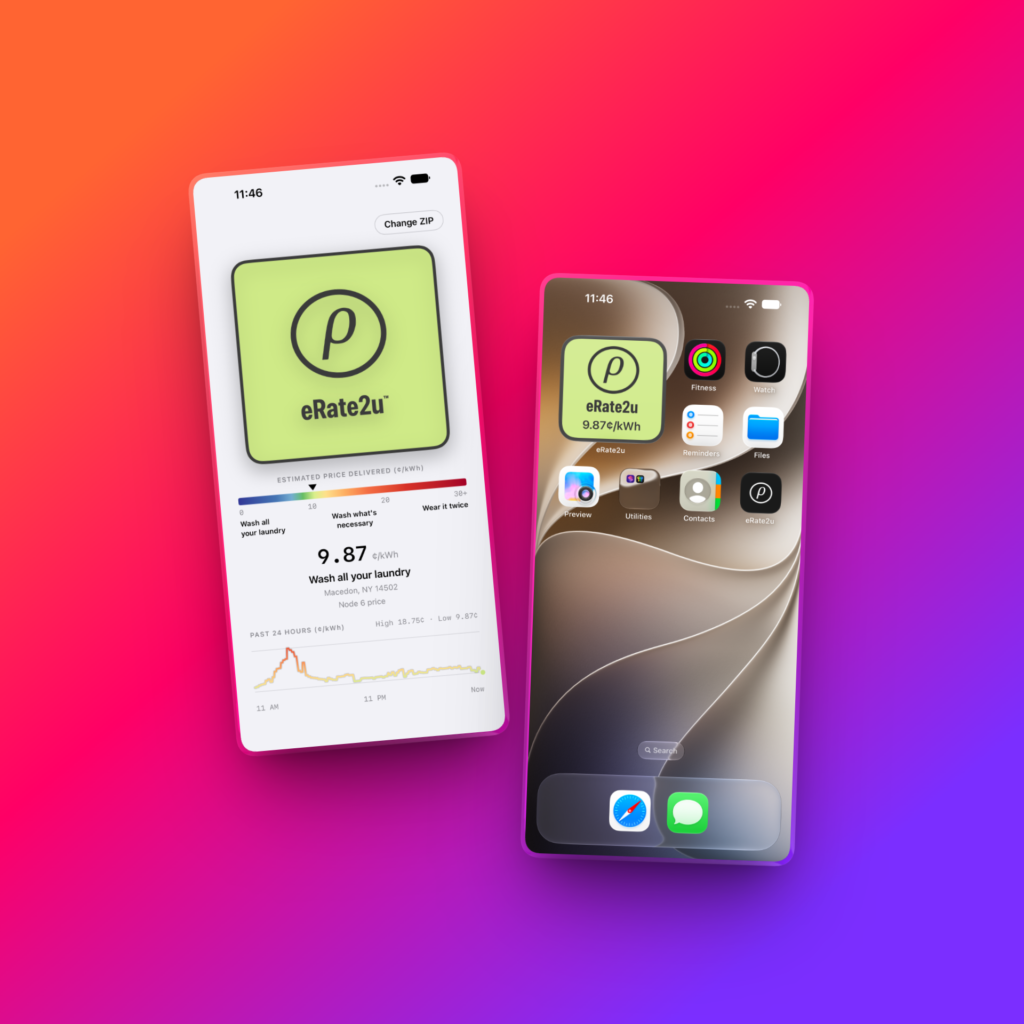
iOS
Know your estimated electric costs right now.
eRate2u calculates estimated delivered electric prices live. Calculations are based on current market drivers and prices, made into one simple signal, so you know when to use power and when to hold off.
These are estimates and are not a replacement for your true electric bill and rates.
For example, someone on a fixed rural rate may not see a need for eRate2u. However, they may see risk during peaking hours…Is your market regulated?
TLDR:
If it’s RED, wait to run those loads of laundry.
For the rest of us:
Read below…
Electricity prices change all day. Now you can see them.
Behind every outlet is a grid market where prices move hour by hour, sometimes minute by minute. Most people never see those swings. eRate2u shows them.
Enter your ZIP code, and eRate2u pulls current prices from the grid nodes that serve your area. It turns them into an estimated price per kilowatt-hour that you can understand at a glance.
One glance. One decision.
1. Enter your ZIP eRate2u finds the grid pricing points nearest you and adds your state’s typical delivery costs, so you get one local estimate of what power costs where you live.
2. Check the tile The eRate2u tile changes color with the price. Cool blues mean electricity is cheap for your area. Warm oranges and reds mean prices are climbing.
3. Decide what to run Delivery costs vary a lot from state to state, so eRate2u’s scale slides to fit your area. Whatever you normally pay, the colors and advice tell you how today compares:
- Low end of your scale: Wash all your laundry. Power is cheap, so run the big loads.
- Middle of your scale: Wash what’s necessary. Prices are elevated, so stick to essentials.
- Top of your scale: Wear it twice. The grid is under pressure, so wait if you can.
In much of the Midwest and South, the scale runs from 0 to 30¢. In higher-cost areas it moves up in 5¢ steps, to 20–50¢ in California, so a reading always means the same thing wherever you are.
See the spikes you’ve been missing.
The 24-hour price history shows what happened while you weren’t watching: the overnight lows, the quiet afternoons, and the sudden spikes where prices jump many times higher in minutes. Each view shows the day’s high and low, so you can learn your area’s patterns and see how often the grid gets stressed.
Your signal to ease off.
Heat waves, cold snaps, and unexpected outages push the grid to its limits. When that happens, prices spike, and that spike is often the first sign of strain.
eRate2u makes that moment visible. When the tile turns red, it’s a cue to delay what can wait: hold the dryer, postpone EV charging, nudge the thermostat. Small changes across many homes and businesses help ease demand when the grid needs it most.
For Homeowners
Run appliances at the right time. Dishwashers, dryers, and water heaters don’t care when they run. Check the tile before starting a big load.
Charge your EV smarter. An EV is one of the largest loads in a home. Plugging in when prices are low, and not during a spike, adds up. Hey Tesla, we see you. Integrate us into smart charging (curtail during peaking).
Make energy something you can see. Instead of a mystery bill at the end of the month, you see what electricity is worth every day.
For Commercial & Industrial Users
At commercial scale, a few cents per kilowatt-hour can add up to real money in a single afternoon.
Curtail during spikes. When prices climb, facility managers can scale back non-critical equipment, lighting, or HVAC until conditions ease.
Understand your exposure. The 24-hour history shows how often and how sharply local prices spike, which helps inform procurement conversations and contract decisions.
Coordinate your team. A single color is easy for everyone to read, from the operations floor to the front office, without anyone needing to interpret market data.
Where eRate2u is Headed
We’re building eRate2u into a full energy-pricing platform. On the roadmap:
- Regional delivery costs: local transmission and ancillary service costs for a truer delivered price. Done
- Commodity indexes and futures: wholesale market and forward contract data to anticipate price shifts. Ongoing
- Weather modeling: temperature extremes and weather events that drive local demand and renewable output. Ongoing
- 30 day & 5 day trends built: will be available after initial rollout. Done
- Free companion mobile apps: eRate2u on your phone and home screen. Soon as of 10-20-26